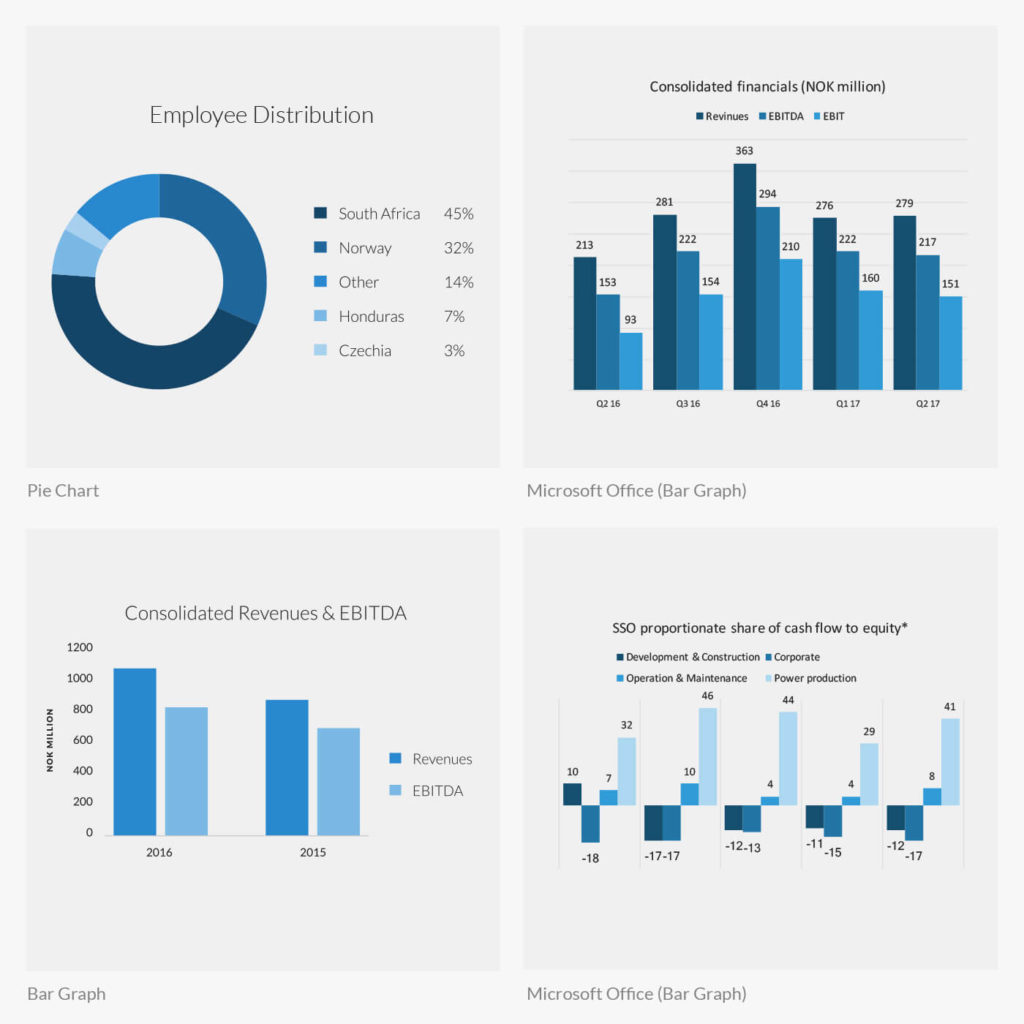
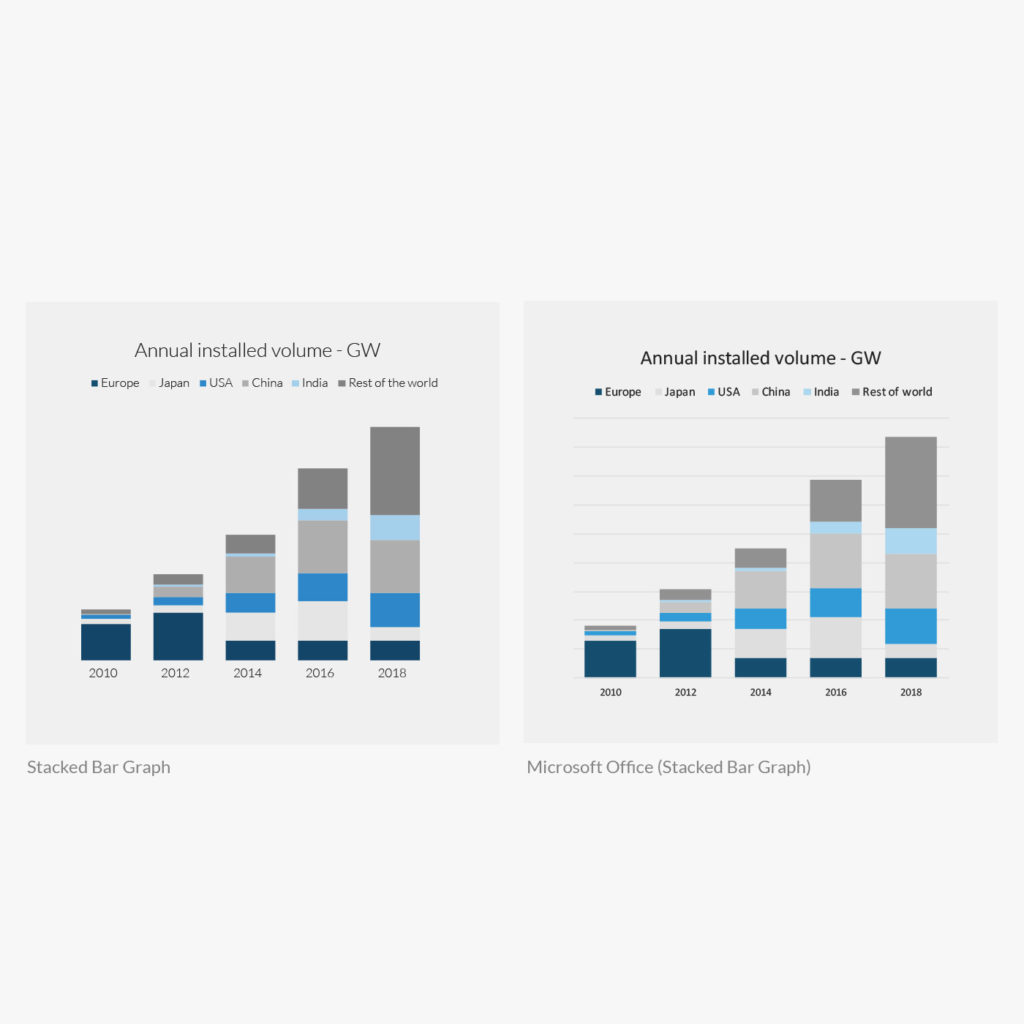
Graphs will have the same tonal colour system the majority of the time. When more complex graphs require more colours add tonal greys from the “Complex color system” tab. The graph type chosen should always be determined by the data itself and contain as many titles, keys and other elements as deemed necessary to make the data absorbable.
The colour system is based in tonal blues for best contrast from data series to data series. This system applies for custom designed graphs and those created in Microsoft office programs.
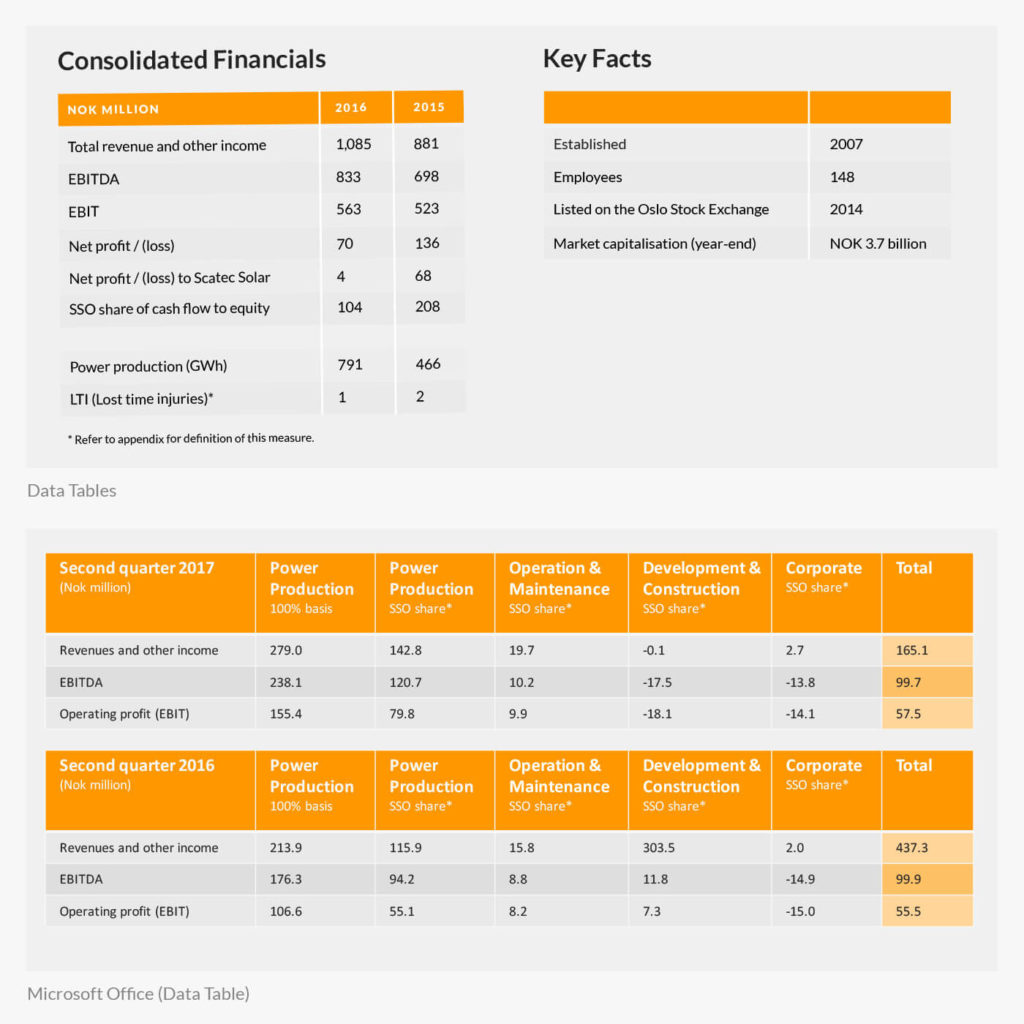
The table design is intended to make the data easily readable. The header row will always appear in Scatec Solar’s orange colour with white text. Additionally, body rows alternate between two greys so readers can easily follow.
The colour system here is tonal with the orange colour emphasising important areas such as the header row and columns that display totals